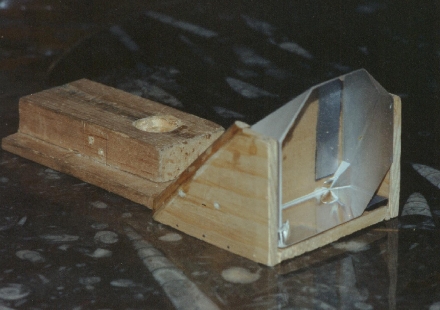
The prism assembly in it's raw state.
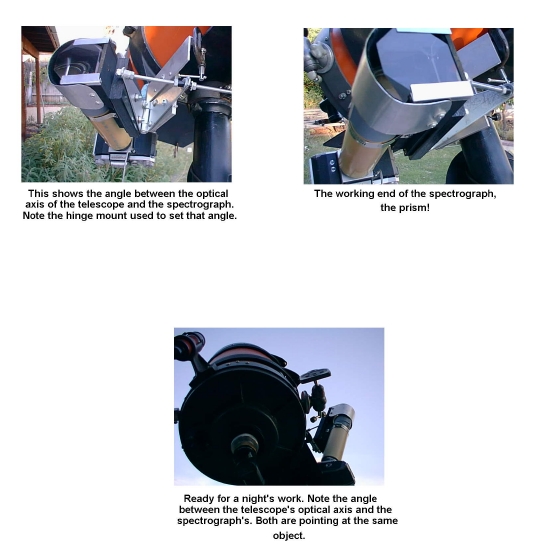
More images of the finished spectrograph.
In this age of kilobuck devices and gadgets, it's easy to forget that many scientific instruments that will help us understand the world around us in principle are easy to build and afford. Presented here is a design and operating instructions a spectrograp, the total cost of which can, as it was in the author's case, be less than $10.
Overview...
Spectroscopy is one of the most enjoyable pursuits in astronomy and physics. The lure of the intense pure colors of spectra and the secrets about the light sources hidden in the absorption and emission lines beckon those of a curious bent into a new field of study. Upon embarking on such a study, one quickly learns that spectroscopy seems to be a rich person's sport. But in fact, it doesn't have to be that way. If one has just average skills with hand tools, a perfectly serviceable astronomical spectroscope/graph can be constructed for a nominal cost.
First it helps to know a little bit about spectra and associated instruments. What is presented here is only the most brief introduction and the interested reader should peruse the literature listed at the end of this paper.
Spectra are formed when light passes through any wedge of transparent material (for that wavelength) that is a different refractive index compared to the surrounding medium (air, water etc.), or when it is diffracted around an intervening object or reflected off a reflective diffracting medium. The most common means of making spectra is to pass light, sunlight for example, through a prism. This will produce a rainbow of colors in a band from red to violet for most eyes. Note the intensity of the pure colors.
While prisms will make this colorful band or spectrum (note that a single one is a "spectrum" and many are "spectra") for a large object like the Sun, this spectrum is a smear of individual spectra from every minute point that makes up the object. If you make a spectrum of the Sun this way and project it on the ceiling in a darkened room it will simply be this bright band with a red tint on one end and a blue on the other. Interpose piece of paper with a slit, some small fraction of an inch in width, cut into it or use a small hole and the bright band will now be a spectrum. If you have made a good slit you may even see a dark line or two running perpendicular to the 'dispersion'. Your device is a spectroscope, albeit a very crude one. The term "scope" denotes the ability to observe the spectrum with the eye. If you find a way to attach a camera it becomes a spectrograph and you have begun to study spectroscopy.
Objective Prisms...
The most simple form of astronomical spectroscopy is objective prism spectroscopy. This consists of putting a large prism in front of a telescope and looking at the sky through that. Everything going into the telescope will first have to pass through the prism so that all you will see are spectra. Instead of making the slit or pinhole mentioned above with the Sun we will rely on the tiny size of the stars to act as a pinhole. It works very well and is a technique used by professional observatories for decades, in one form or another. The professional telescope with the most of these objective prisms is the Burrell Schmidt Telescope owned and operated by Case Western Reserve Univ. on Kitt Peak. It has 5 prisms, four of which can be used in various combinations, all of which can be used singly. The dispersion or spreading out of the light into the spectrum, is done in a north-south orientation or along a line of right ascension. When using this as a spectrograph the widening of the spectrum can be done by varying the telescope drive rate. It is this kind of spectroscope/graph that is the easiest to make and use.
Building an objective prism spectrograph...
A very effective spectrograph of this type can be made by any amateur astronomer with reasonable abilities with hand tools. The items needed will be:
1 camera and telephoto lens (~250-500 mm) as small an f/no. as possible
1 large prism that can cover the lens of the telephoto.
misc. wood and metal bits that can make your mounting.
The first and most difficult part for most is getting a prism. For this you will have to prowl the surplus houses either on the Internet, in magazines, or in your local town. AstroMart, C&H Sales and EBay are all good places to start your search for a prism on the Internet. It need not be a thing of beauty, which will help to keep the cost down. I got my prism from a surplus house for $2. It is a right angle prism with 2"x2" faces and has a chip in it, hence the very reasonable price. Right angle prisms are the most inexpensive. This chip has no effect on the performance in this application. Most objective prisms have very slight angles and rely on the long focal length of the telescope to spread the light out into a nice, well resolved spectrum. We don't have the luxury of a long focal length here so we need more dispersion to spread the light out. This means a greater wedge to the prism. So we will use one half (actually a bit more) of this prism making use of one of the 45 degree angled halves to be our objective prism so you want these smaller faces to be a little bigger than the diameter of the front lens of your camera.
I used an old Praktica camera body and attached it to a 270 mm achromat aligned and mounted in a piece of PVC tubing. The lens cost about $8 and the camera body was free, a throw-away that was given to me since only the "bulb" position worked on the shutter. The camera and lens should be mounted to a board and the prism fashioned in some manner so the hypotenuse is towards the camera lens entrance with one of the smaller faces of the prism facing the sky. As fig.1 shows, you will want to mount your camera a little higher than the prism so all the light goes into the lens. Keep things away from the front of the prism. Your spectrograph will be looking off at about a 23o angle as shown in the figure.
What is shown in all the figures with this paper are schematic only. You will have to use your creativity and materials to best advantage to accomplish this project. The photographs of this spectrograph first built in 1984, show what I did, but perhaps you have a better way or have different materials.
Mount the spectrograph to a telescope mounting. There are as many ways to do this as there are telescopes. Keep in mind the pointing difference between the spectrograph and the telescope. Mount it so the dispersion or spread of the spectrum runs north-south. You may wish to mount the device so it physically points in the same direction as the telescope but then you will be constantly making the offset for the prism. I found it much more convenient to make a piggy back mounting on a large hinge that was adjustable so I could set it to be looking at the same object as my telescope. The advantage is that I always know what is in the spectrograph and when.
Now to work...
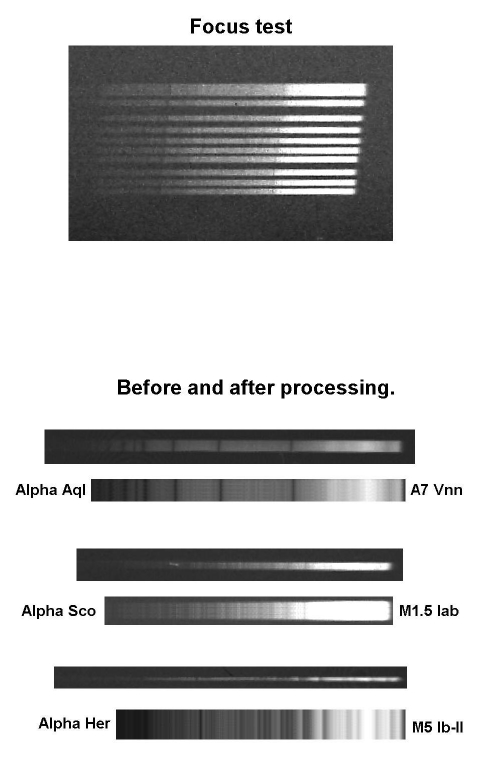
The first thing you have to do with a new spectrograph is determine the focus. While you may know the infinite focal position for the camera lens,the introduction of the prism will change this to some degree. It will likely require some test exposures to accurately determine the new infinite focal position. An excellent star for this test is Vega as it has good strong balmer lines. I recommend using a film like T-Max 400 and processing it for good contrast (8 min @ 70 deg. F, with 5 sec. agitation every 30 sec.). Take short exposures, and shift the focus and telescope pointing between them so you have a series of unwidened spectra on your frame. You will notice one thing right off as you examine them under magnification. One position will work best for the red end and the other will work better for the blue end. (The red end is generally the brighter end, even with a blue star like Vega because of film sensitivity.) Select the one that as the best focus in the middle or a little to the blue end, between H-Beta and H-Gamma. If you don't know the hydrogen series, you might want to get familiar with it at this point. Just learn which lines are which, where the "Balmer Jump" is and what the series looks like. Also take time to note where the H&K lines of calcium are. They become important when determining spectral class.
Next you should do this same focus test but this time widen the spectra by an amount that will make them half a millimeter or so wide on the negative. This time you will determine focus by looking at the lines of hydrogen in the spectrum. You will now plainly see the effect mentioned above, the best focus will move across the spectrum as you change focus. Again, pick the setting with the sharpest H-beta or H-gamma line.
Now that you know where the good focus is, set your lens to best focus and take exposures of a number of different stars. Try to find a good selection of bright stars like Vega-Deneb-Altair and use the sidereal drift of the sky to widen the spectra. Then select some fainter ones of varying spectral type too. (For fainter stars you will have to use an offset R.A. drive speed from the sidereal rate.) The object here is to get a selection of sample images for the first roll of film, from which you can make a time/brightness/spectral type/exposure/widening plot so every image will be a useful one in the future, that's the goal. You'll undoubtedly fall short of this and it will take some work to get it right the first time. After your first roll of film you should have a selection of stars from 0-3rd mag. or so. This will be enough to determine your best exposure time. You should plot the results in some manner for use at the telescope later. I did a plot of magnitude versus time with separate plotted lines for the B & A stars and another for the M and later stars. Between these two curves are the F & G stars and above it the O stars. This plot covers only the best exposure for an unwidened spectrum. That should be all you need to know. Determine what the width of the stellar image is in your camera and use that number as your step size in widening the spectrum. Thus when looking in the eyepiece as you widen, take an exposure of the star in one position, say 20 sec., then step over the predetermined distance and take another and keep repeating this procedure until you have the required width. Another time saving technique is to do a portion of the widening at the telescope and stack that spectrum several times in the darkroom or on the computer. This will also help to avoid sky fogging.
With my system, a 270mm lens (f/6.2), I find that Vega is perfectly exposed using sidereal drift alone. But Arcturus needs 5 sec. exposures at each step across the film. I keep widening to 0.1-0.3 mm depending on the object with my longest exposure being around 10 min. total. You will have to make very sure that your system has no sag in it. This would be disastrous to detecting spectral lines. Red stars, at least with this film and my optics, take about 3-5 times longer to expose well as the Vega/Antares comparison indicates. Carbon stars, like Y CVn may take even longer.
A First Program...
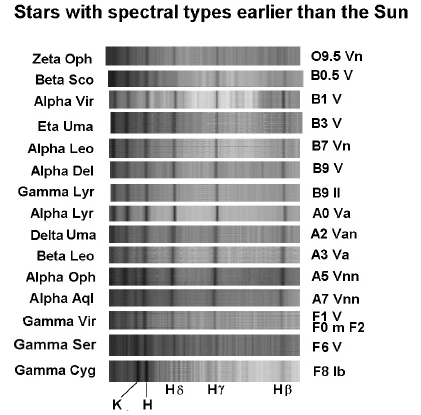
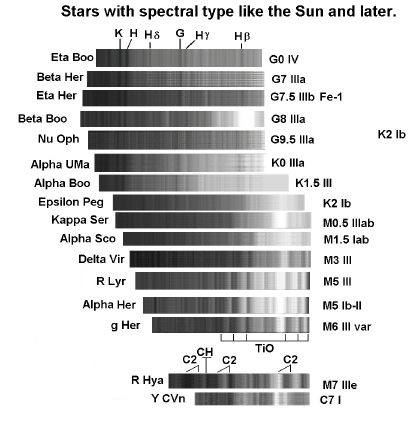
Now that you have the technical details out of the way you will want to do something of value with this contraption. One of the first things you should do is take images of every bright star you can shoot with an eye towards getting a couple from each spectral class. You will need an atlas of such spectra and there are some available on the web, found by searching for "stellar spectral classes" or some permutation of that phrase. Some of these are from university courses in astrophysics and thus well suited to this task. This project will likely keep you busy for some time, but you need to make a good spectral atlas with your instrument, using your techniques, at your location. This can then be used for comparison with unknown objects in the future.
Learn how to do the step widening with your system and try to do some widening at the telescope and some with software in the computer by replicating blocks of your spectra. This will give you a good looking, easy to read spectrum. You will soon learn the pitfalls of poor signal-to-noise as you try to pull a workable spectrum out of a poorly exposed image. This will be good experience.
Your ability to record faint objects will only be limited by your sky and patience. There is no reason why you could not spend hours making one spectrum if your sky were good enough.
After you have assembled a good catalog assemble the images into a form that shows the different spectral types, their features and intercomparisons. If you get good at this you may even be able to discern different luminosity classes, but be forewarned, this usually takes a slit spectrograph. Take time and do this well because it will be your reference source. A mistake or sloppiness here will lead to bad results later. You will find that this process of making an atlas, will never end. As you discover unusual objects on your images (intentional or otherwise) you will constantly add to this database.
The sky's the limit!
Now you can either go on a search for particular objects or sit and wait for them to come to you. When you hear of a bright nova, get a spectrum. Comets like Hale-Bopp can present a wonderful object for study. The emission spectrum of this object, as with many gassy comets, changed from night to night. Take spectra of these objects from night to night and stack them into a time sequence to show changes. This can also be done with brighter variable stars or those that are bright for at least part of their cycle.
Once you have a device like this in your astronomical arsenal, you will
begin to look at the sky in a whole new light!
GLOSSARY...
Absorption lines - The dark lines that perpendicularly cross an absorption spectrum.
Absorption spectra - Spectra where the lines are black on a bright
spectral background (continuum)
Continuum - The bright background made by a prism or grating when
looking at a normal incandescent light bulb. This is often the
background on which spectral dark or bright lines are laid when looking
at things like the Sun or Moon (dark lines) or a fluorescent light
(bright lines).
Continuous spectra - Spectra where there are no lines, only a smooth
gradation through the colors from red through violet. Most easily seen
in the spectrum of an incandescent light bulb.
Dispersion - The direction of the spreading out of white light into a
spectrum.
Emission lines - The bright lines that perpendicularly cross an
emission spectrum.
Emission spectra - Spectra where lines are bright against a dark or
weak background of spectral colors.
Grating - A piece of glass or plastic on which lines of a particular
shape are scratched or laid on such that they break light up into the
spectrum.
Prism - A large piece of glass in one of a number of geometrical shapes
that can, in certain orientations, break up light into a spectrum.
Spectra - The rainbow of colors produced by a prism or grating (a CDROM
acts like a grating). One is called a spectrum, many are spectra. There
are no such things as spectras, and spectrums.
*This paper is copyright (c) Richard E. Hill 2000
BIBLIOGRAPHY
Birney, D.S., OBSERVATIONAL ASTRONOMY, Cambridge Univ. Press, New York,
1991. [Best, easily available book for information on spectral
classification.]
Cutting, T.A., MANUAL OF SPECTROSCOPY, Chemical Publishing Co., Inc.,
N.Y., 1949.
Hearnshaw, J.B., THE ANALYSIS OF STARLIGHT - One hundred and fifty
years of astronomical spectroscopy, Cambridge Univ. Press, New York,
1986.[An excellent book on the history of spectroscopy and spectral
classification.]
Houk, N., and Newberry, M.V. A SECOND ATLAS OF OBJECTIVE-PRISM SPECTRA,
Univ. of Mich., Ann Arbor, MI 48109-1090 ($6) [A superb reference
source at a very reasonable price!]
Sawyer, R.A., EXPERIMENTAL SPECTROSCOPY, Prentice-Hall, Inc., 1946.
(Reprinted by Dover, 1963.)
The prism assembly in it's raw state.
More images of the finished spectrograph.
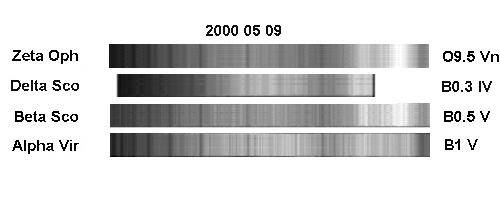
This is an image showing a pre-brightening spectrum of Delta Sco. What
can be seen here is how the hydrogen lines are mostly filled in by
emission in the early stages of the "outburst".