X-ray mapping is a powerful technique that allows imaging the spatial distribution of chemical elements within a sample. It is extremely useful for revealing chemical zoning profiles, identifying the phases in a sample, determining the extent of diffusion or corrosion of a material, locating small or unexpected phases in the sample, deducing crystallization history of a rock or alloy, and a variety of other applications.
X-ray mapping on our electron microprobe is performed by setting the WDS spectrometers to detect the elements of interest and then either rastering beam (beam scanning) over the sample or moving the sample stage (stage scanning) under a fixed electron beam. The result is a map of x-ray intensity (depicted by different gray-scale levels) vs. position for a rectangular area of the sample surface. Beam scanning is used to map areas ≤ 200 μm in size. Stage scans are used for larger areas and can cover areas up to several cm in size. Four element maps and one backscattered electron image can be collected simultaneously. At the highest resolution of 1024 pixels per line, the minimum time for collecting each set of maps is ~2 - 4 hours.
Another use of x-ray mapping is fast x-ray dot mapping to quickly distinguish between phases that have similar atomic numbers and thus cannot be readily distinguished by backscattered electron imaging. Fast x-ray maps are relatively grainy and are limited to areas of about 250 μm square. However, they can be collected about 1 - 10 min.
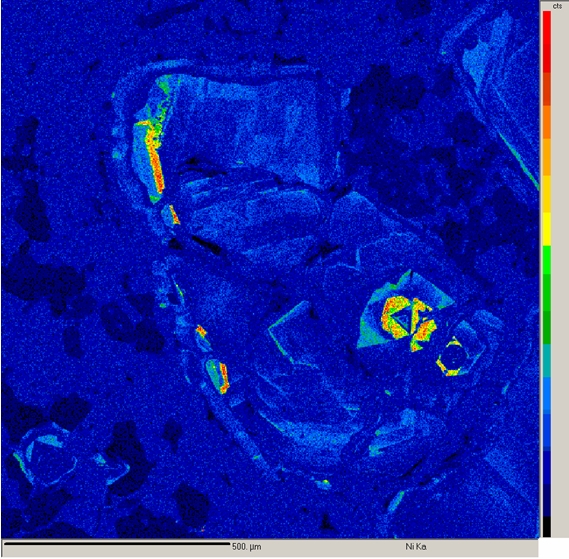
Ni x-ray map displaying Ni growth zoning in pyrite grains from a metamorphosed U-Cu ore deposit.
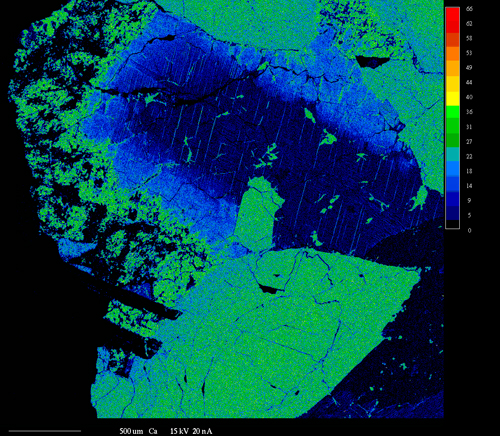
Ca map of a zoned pyroxene grain (center) with a pigeonite core and augite-rich rim. Plagioclase (lower) also displays zoning, becoming more albite-rich towards its upper left edge.